In the case of Nigeria it's dirt simple: we keep them in the stone age so they don't use up their crude internally.
See also http://sweetcrudemovie.com/
Any questions?In the case of Nigeria it's dirt simple: we keep them in the stone age so they don't use up their crude internally.
See also http://sweetcrudemovie.com/
Any questions?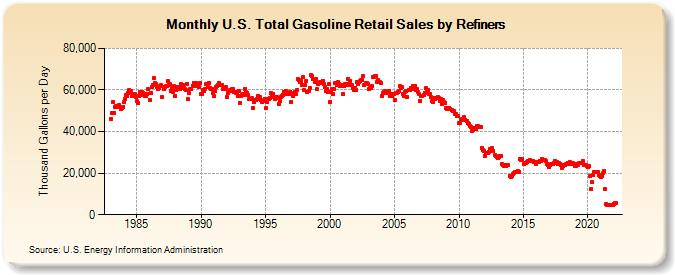
In six years, from 2005 to 2011 US refineries have gone from delivering over 60,000,000 gallons of gasoline a day to about half that.
Part of it is undoubtedly the issue that small refineries that are not "complex" in that they cannot process heavy and/or sour crude are folding world-wide. Their replacements are colossal, complex refineries that can process low-quality crude.
Angry refinery workers take message to Harrisburg (link)These complex refineries that are replacing the lesser ones are not located in the US.
Kathleen E. Carey / Delco Times /February 8, 2012In September, ConocoPhillips idled the Trainer plant, and its employees were laid off last month. In December, Sunoco Inc. idled the Marcus Hook plant, and it is anticipated that company will terminate those workers at the end of this month.
Sunoco officials also previously announced their intentions to shut the Philadelphia refinery by July at the latest, if a new owner has not been identified.
... The number of refineries in the United States has dwindled to 118 from 300 in the 1980s, and now the region faces the loss of these three.
Oil refineries likely to close across UK and Europe, Essar Energy boss warns (link)This is an inevitable result of having consumed the world's light, sweet crude oil first leaving the heavy, sour for now.
India's Essar says larger refineries such as its Stanlow facility in Cheshire will survive competition from Asia and the Middle East – but warns many will not
Dan Milmo / The Guardian / February 27, 2012"There is some sort of structural change in the refining industry globally," said [India's Essar Energy's chief executive, Naresh] Nayyar. "Refineries that were small-sized or low-complexity are being replaced by large, complex refineries mostly built in the Asia-Pacific region … Those refineries that are not economically sustainable or of low complexity will find it much harder to survive in this market."
Updated:
The Peak Oil Crisis: East Coast Refineries Redux
Tom Whipple / Falls Church News-Press / March 6, 2012It has been six weeks since we last discussed the problems that could be in store for the U.S.'s East Coast due to closing of refineries in the Philadelphia area.
Last week, the U.S. Department of Energy issued a second, more detailed report on what could happen to the availability of oil and prices in the event the third and largest of the three Philadelphia refineries in question be forced to close down this coming July. In contrast with most DoE reports, this one contains a clear, unambiguous warning that there likely will be serious troubles later this year and on into 2013 in the form of local shortages and higher prices for gasoline and other oil products.
Total Liquids in Barrels over Time.For an example of this I will use a recent post to The Oil Drum which features a chart based on US DOE EIA data for total liquids in barrels over time.
January Oil SupplySo what is wrong with this chart?
Stuart Staniford / The Oil Drum / February 24, 2012
Total liquid fuels were at all time highs in January,
according to OPEC and the IEA.
Energy Units and Conversions (link)Approximate values, but good enough for this statement:
by Dennis Silverman / U. C. Irvine, Physics and AstronomyCrude Oil [contains] 5.6 million BTU/barrel
Natural gas liquids [contains] 4.2 million BTU/barrel
To combine various liquid fuels with different energy densities into a single count of barrels over time conceals reductions over time in the available energy from those liquid fuels.
As an analogy, would you expect to see a report covering up a copper shortage by showing only combined data of pounds of copper plus pounds of cement in an unspecified ratio? Yet few people question reports showing combined barrels of liquids that contain very different amounts of energy.
Creating a chart showing Total Liquids in BTUs (not Barrels) over Time would not be a complicated thing to do. Such charts probably exist in private and they probably look frightening because the world is probably running on less energy from liquid fuels over time now.